The Cause and Effect
- angenettenordqvist
- Sep 11, 2022
- 2 min read
Updated: Sep 11, 2022
How do you solve a problem like Maria? ♫ Any "Sound of Music" fans out there?
I wrote an earlier blog, "But Why?" to take you through the simple 5 Why's Root Cause Analysis tool. This time, I thought I'd write about the classic Cause and Effective Diagram.
The cause and effect diagram is sometimes referred to as the fishbone diagram. (You'll understand why shortly.) Kaoru Ishikawa popularized this tool in Japan working in the Kawasaki shipyards back in the 1960's which is why some refer to this tool as the Ishikawa diagram.
Nonetheless, I like Cause and Effect because this very accurately describes this tool.
When looking for root cause, we are actually wanting to determine the independent variables, the X's, that are driving behavior of the dependent variable, the Y. You may recognize the linear equation Y = f(X). In words... Y is a function of X. And since few problems are simple, the equation more likely looks like this: Y = f(X1, X2, X3...).
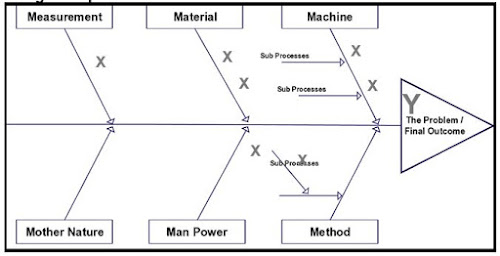
The Cause and Effect diagram will allow us to assess the effect, the Y, and the causes of the behavior of the effect, the X's, in a nice visual manner. Let's have a look. (Now you can see why it's referred to as a fishbone diagram).
Gather a group of colleagues who are familiar with the process or issue at hand. Bring in a subject matter expert or two. Write the bones of the cause and effect diagram on the whiteboard in the conference room and begin brainstorming. Remember, in brainstorming, we don't judge. Instead, we encourage ideas to come out.
Start with the problem statement, in form of a question. Example: Why did the scrap rate increase on product xyz123 in February? This is the Y, the scrap rate is the dependent variable. Write this question in the fishhead.
Then begin brainstorming by category. Here you see the independent variables, the X's, can be categorized into 6 categories (or 6 M's): Measurement, Material, Machine, Mother Nature, Manpower, Method. Come up with ideas and go down a few layers so that you add bones on bones.
Once you have completed the brainstorming, try to organize and assimilate the X's. Discuss and see if you can narrow the list to 1, 2, or 3 groupings. One way to do this is to simply vote. Give everyone a chance to choose their respective top 3 drivers of the problem, the X's to the Y, the independent variables to the dependent variables. Once you have identified what is believed to be the top drivers, disperse and begin collecting data to substantiate what the group sees as the main drivers.
After a good collection of data, the group can come together again to verify the root cause(s), document this in the problem-solving tool, and the corrective (& preventive where needed) action planning can begin, or CAPA planning. This will be the topic for a blog on another day.
That, my friends, is the cause and effect diagram.


Comments